It's time to buy the crypto dip
Sep 16, 2021
We saw a swift deleveraging event in an overheated market—creating what we believe are ideal conditions to buy the dip.

TLDR: Given we believe on-chain fundamentals are still strong and still bullish, last week’s retest of fundamental and technical indicators indicates that this is a good time to buy the dip in Titan Crypto.
As discussed in our research update last week, August was a strong month for the crypto market, following the selloff in May and consolidation in June and July. August’s runup was supported by a surge in activities around Non-Fungible Tokens (NFTs) and Decentralized Finance (DeFi) initiatives, as well as a series of catalyst-rich headlines on multiple layer-1 smart contract platforms.
ETH underwent its EIP-1559 upgrade; Cardano launched its highly anticipated smart contract upgrade; Solana gained mainstream interest; and a whole range of other Layer 1s (including Avalanche, Fantom, Celo, Harmony One, and Algorand) began to offer incentive programs to attract users and developers to their platforms.
The renewed optimism around these developments led to the market being significantly over-heated and over-leveraged. For example, Ethereum perpetual futures open interest hit a new all-time-high, and funding rates were also rising to a level prior to the May sell-off.
Last week’s sell-off event cleared out much of the accumulated leverage, liquidating more than $3.5 billion of longs.
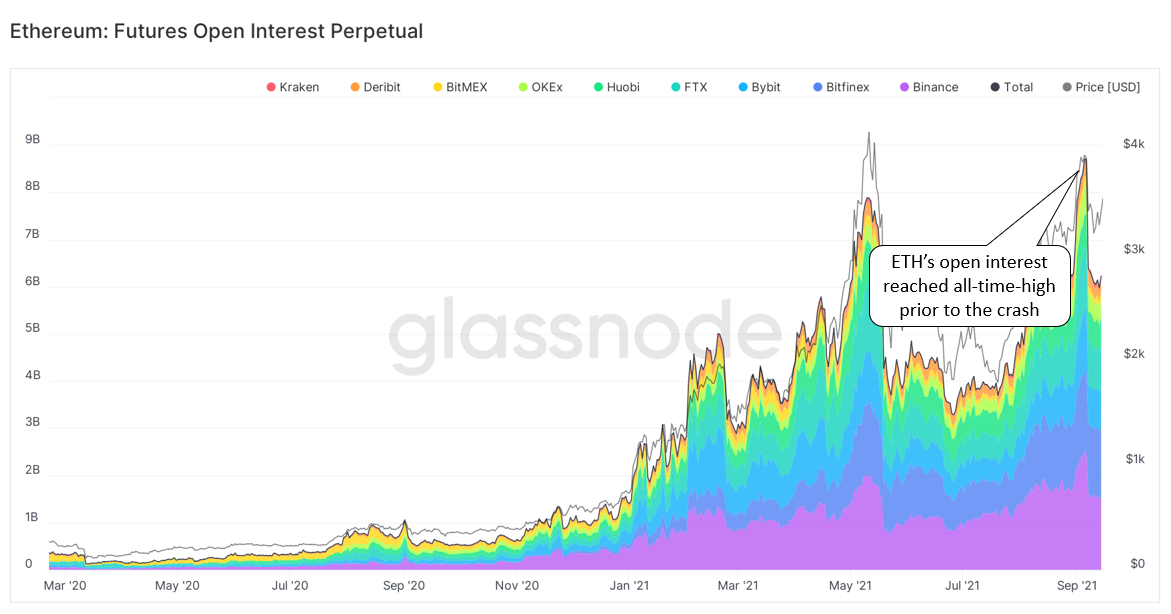 Sources: Glassnode, Titan analysis
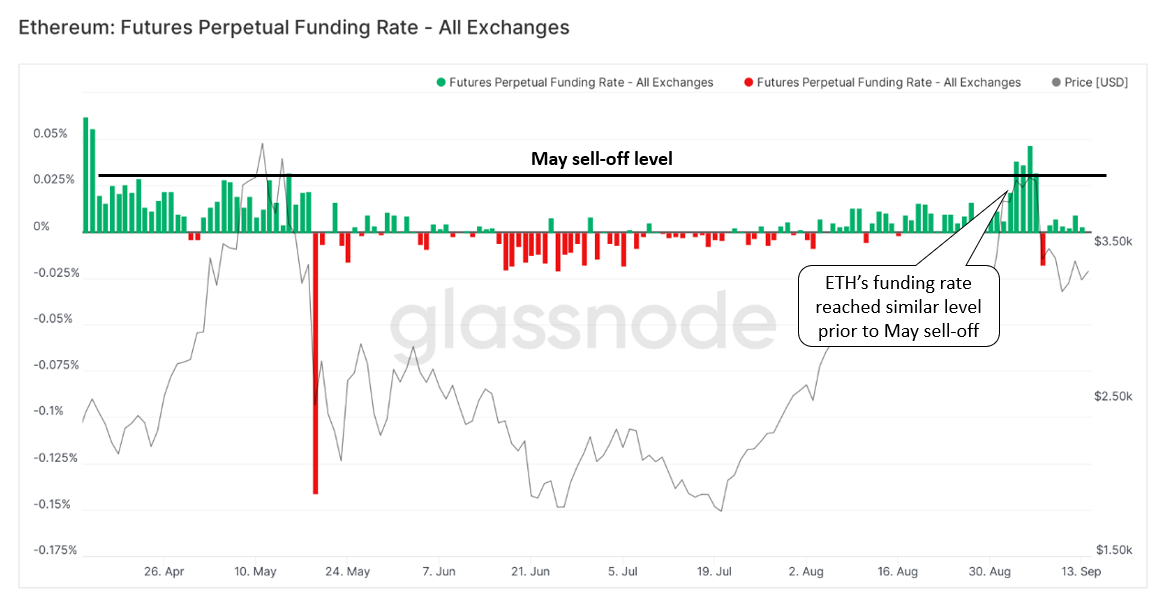 Sources: Glassnode, Titan analysis
On-chain analysis suggests selling was predominantly done by short-term investors, while whales or long-term investors continue to accumulate.
While the price of BTC sold off from its peak of ~$53K to $44K from the crash, whales (aka addresses holding more than 1000 BTC, excluding exchanges) continue to increase their holdings.
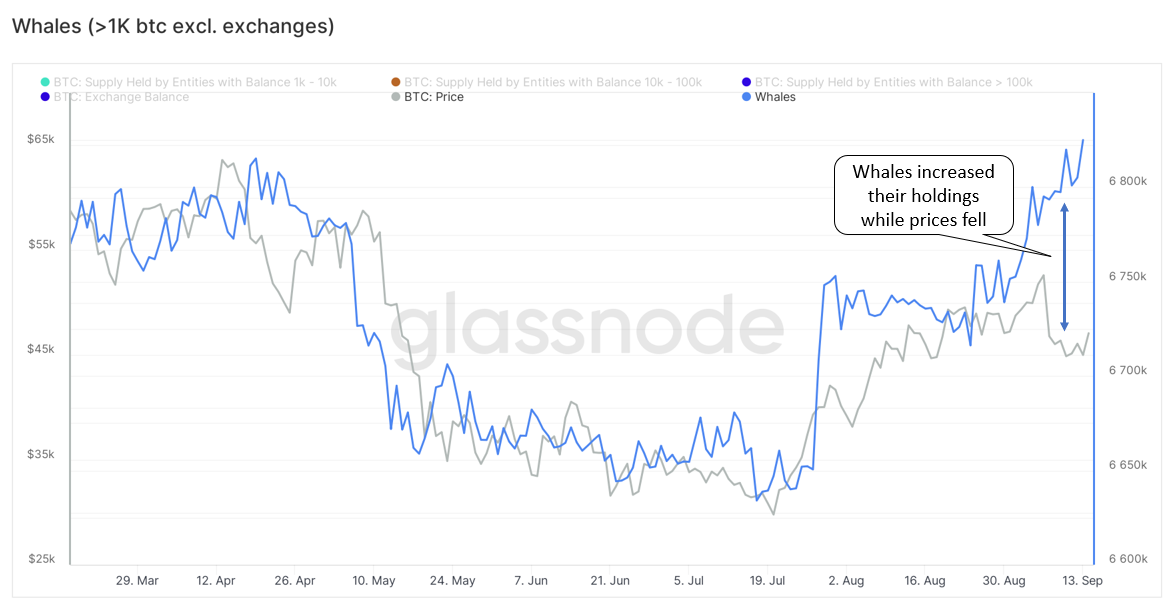 Sources: Glassnode, Titan analysis
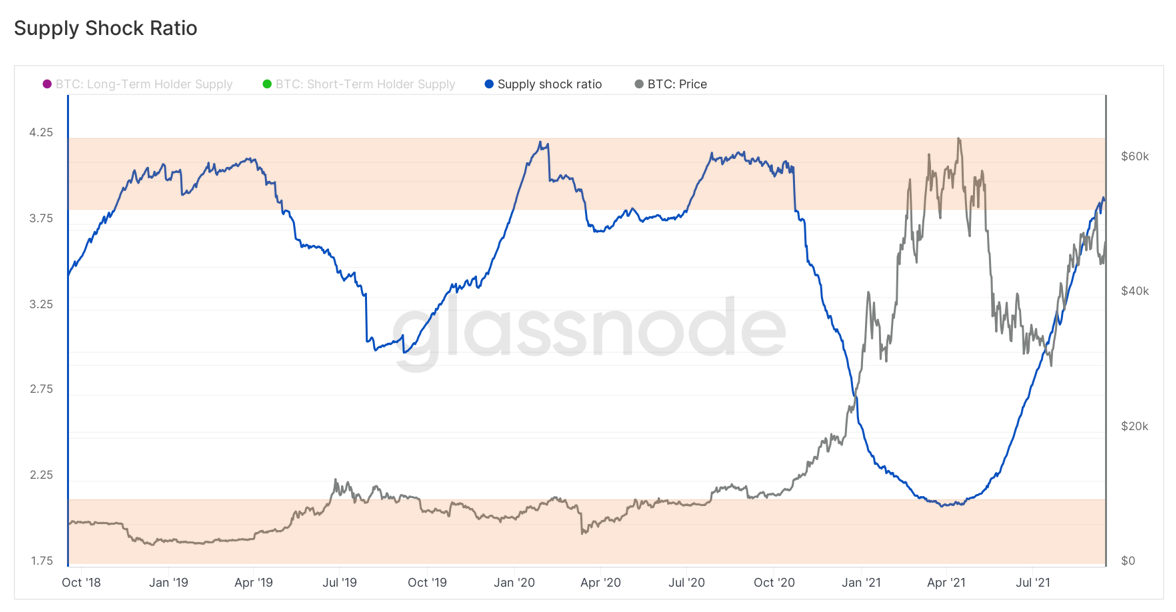
Another perspective: Long-term holder (LTH) supply also reached all-time highs on an absolute (12.94M BTC) and relative basis (86% of all BTC, excluding lost coins). You can see from the graph below that peaks in LTH supply usually predate a supply squeeze and the start of cyclical bull runs.
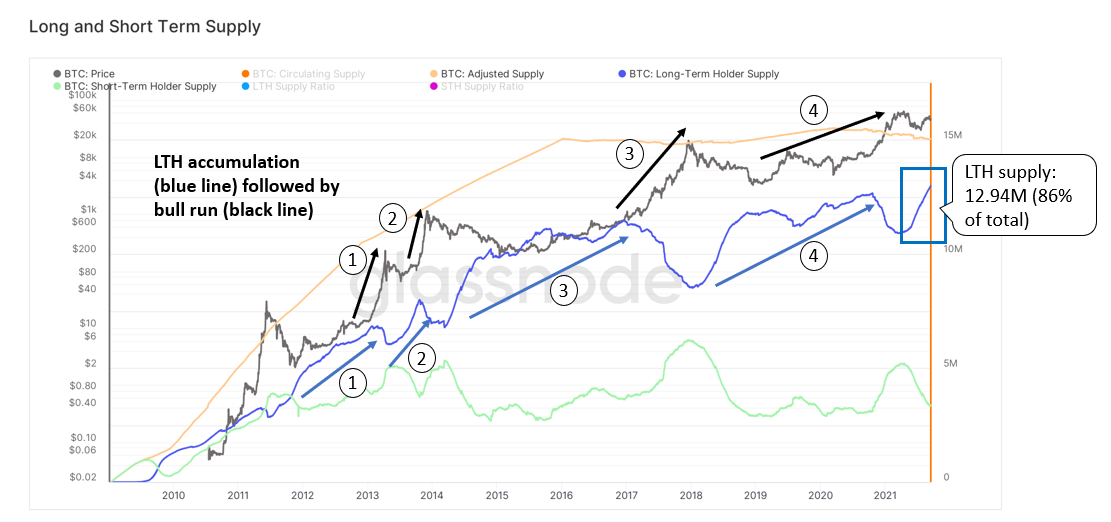 Sources: Glassnode, Titan analysis
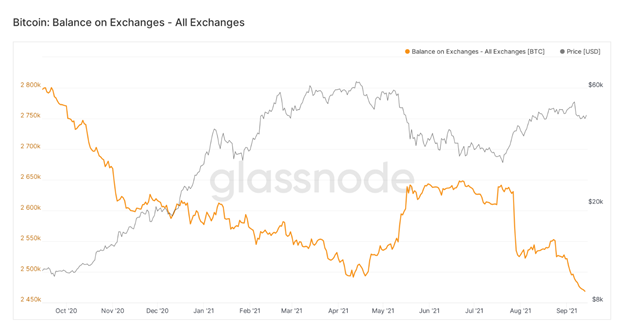
Exchange reserves are also at 3-year lows, confirming the structural trend of increasing coin illiquidity that has dominated on-chain supply dynamics. This metric shows the total amount of BTC held in the wallets of all centralized exchanges (Coinbase, Kraken, FTX, etc.)
A decrease in their reserves suggests to us that more buyers are moving coins to their wallets for long-term “HODL-ing.” (On the other hand, an increase would suggest that investors are depositing their coins for selling, or withdrawing to fiat or altcoin purchasing.)
 Sources: Glassnode, Titan analysis
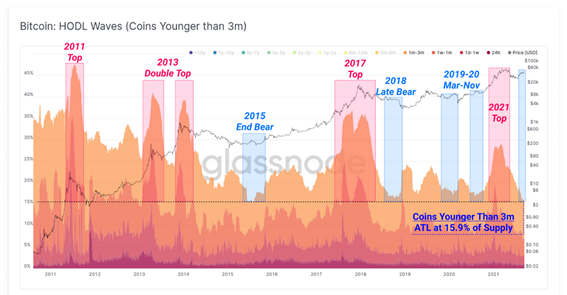
The HODL Waves graph below displays the age distribution of all bitcoins in existence (since they were last transacted or created), showing that the proportion of “young” coins is at an all-time-low. The idea is that smart money investors typically accumulate during bear markets when hype and interest are at their lowest, taking “young” coins out of liquid circulation and maturing them into “old” coins over time.
These investors then distribute and sell to new investors (typically retail investors) during bull runs. The chart below by Glassnode shows that the current proportion of coins younger than 3 months is at an all-time low.
 Sources: Glassnode
The degree of supply shock effect—caused by more and more coins being locked up by long-term holders—can be approximated by dividing LTH supply with STH supply. We can see that the ratio is now approaching a zone that historically caused a supply shock effect (the start of a bull run), as long-term investors lock up a substantial portion of BTC.
 Sources: Glassnode, Titan analysis
Healthy on-chain network activity in Bitcoin and Ethereum
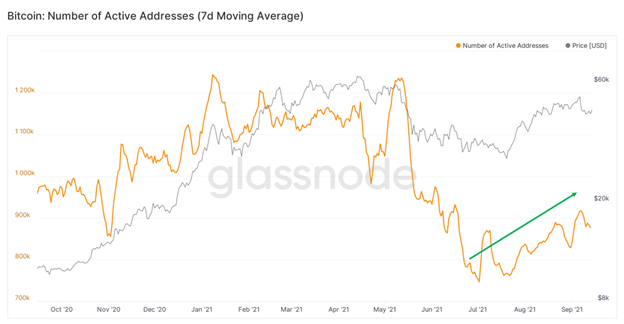
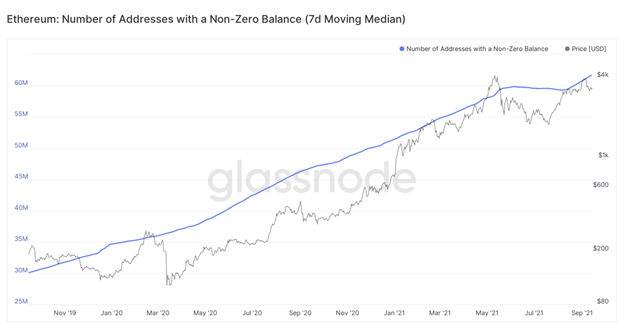
For both Bitcoin and Ethereum, the number of daily active addresses and number of addresses with a positive balance continues to recover from the May selloff, indicating strong trends of adoption, interest, and accumulation.
 Sources: Glassnode
 Sources: Glassnode
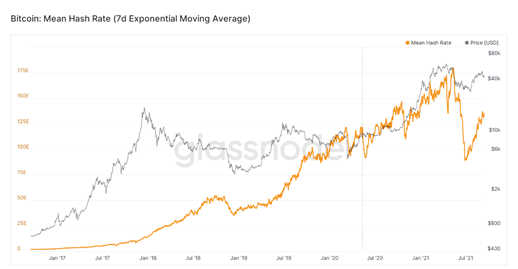
We can also look at the hash rate to assess the health (or security) of a Proof of Work blockchain network. The more machines dedicated to the network, the higher the hash rate rises and the harder it becomes for malicious agents to disrupt the network. BTC’s hash rate continues to recover after the sharp drop in May that was caused by China’s ban of Bitcoin mining. BTC’s long-term fundamentals remain strong and its survivability across multiple crypto winters is truly impressive.
 Sources: Glassnode
Using on-chain data to determine price support/resistance levels and when to buy
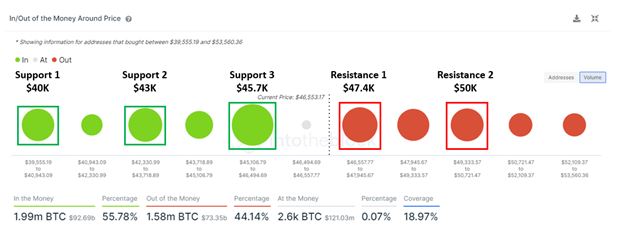
On-chain data is also useful for those fond of technical analysis. The chart below creates clusters based on the volume of addresses that had previously bought in a certain price range. The larger these clusters, the more support/resistance is expected around these price levels. We can see that BTC has three main support levels at $40K, $43K, and $45.7K, and two resistance levels at $47.4K and $50K.
 Sources: IntoTheBlock, Titan analysis
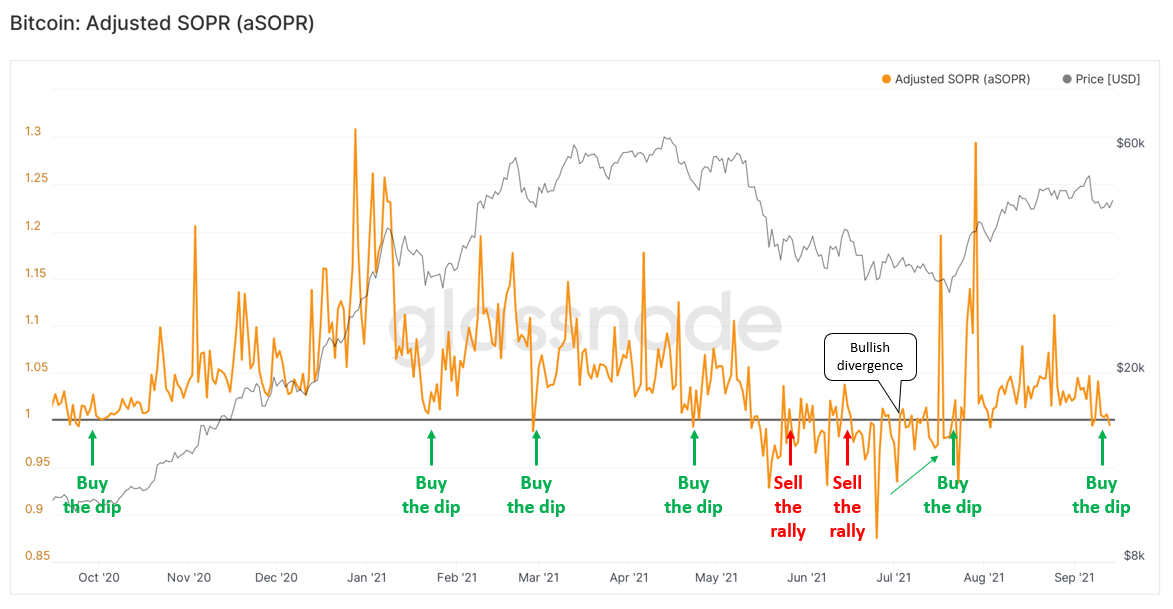
We can also use Spent Output Profit Ratio (SOPR) to help decide when to “buy the dip.” SOPR is a measure of the state of profit/loss carried by the coins trading on any given day. SOPR value greater than 1 implies that the coins moved in a certain time scale are, on average, selling at a profit.
The chart can be interpreted in two ways, depending on market cycles. In bull markets, the retests of 1.0 serve as great dip-buying opportunities. Conversely, in bear markets, a ratio of 1.0 can be used to fade each rally (sell overvalued assets).
Given we believe on-chain fundamentals are still strong and still bullish, this week’s retest of the 1.0 line indicates that this is a good time to buy the dip.
 Sources: Glassnode, Titan analysis